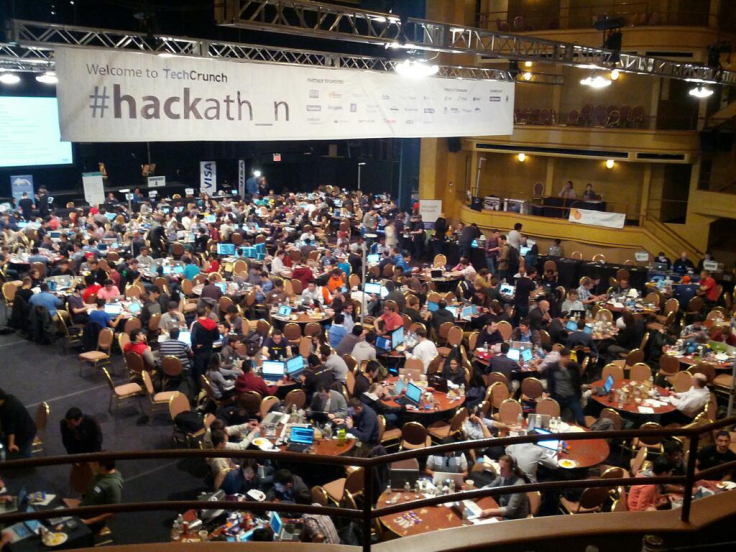
Artist Rendition (not to scale)
Website: HackOH5.ohio5.org
Date: Fri, March 31st – Sat, April 1st
Location: College of Wooster, Library
Mentors/Workshops on-sight: Text mining, analysis, GitHub, etc
Goal:
Experiment with data, deconstruct it, combine it with other data, visualize it, contextualize it and explore what this tells us about our history.
Data:
- 5 College Newspapers: Denison, Kenyon, Oberlin, Ohio Wesleyan, College of Wooster
- 170,000+ pages
- From 1856, over 160yrs
- Provided in batch/file dump or online REST API calls
- File formats as single/multi-page PDF, jp2, xml and html format
- Varying OCR quality (relatively noisy data)
- Style, layout and OCR quality varies by microfiche quality, time period, scan software, font, layout, etc
Examples:
See 3 examples posted on HackOH5.ohio5.org website.
Guidelines:
- All Narratives/Stories/Research are based upon Data in some form
- Find the most interesting story embedded within the Data
- Don’t force the data in a particular direction, let it lead you in your area of inquiry
- Ask a progressively narrower sequence of open-minded questions
- Backtrack, modify questions with preliminary data exploration, iterate
- Think in multiple dimensions, datasets (external mashup) compare, contrast, set a baseline for comparison
- All Data is fundamentally represented, manipulated, analyzed and visualized numerically.
Kenyon CWL/IPHS Digital Humanities Team Approach:
We’ll divide our efforts into three distinct, but somewhat overlapping and intimately connected teams:
- Text Wrangling Team – Get, clean and normalize dataset. Minimal programming, mostly setting parameters in calls to various Python Libraries.
- Analytics Team – (tech) run various Machine Learning (ML) analysis on the dataset and (non-tech) closely explore/examine data to find structure and meta-data that lends itself to exploring various questions in fields of humanities.
- Data Visualization Team – get a good feel for the underlying data, ML output results and humanities research question and translate that into the most engaging and intuitive visual experience
Text Wrangling – Part A Clean Data
- Performance (languages, data types, idioms, libraries, parallel processing, local, cluster, cloud)
- Get physical copies of data files
- Selectively rescan?
- Sample with statistical rigor?
- Identify Titles
- Identify Topic Sentences/Summary Sentences
- Whitespace Filter
- Apostrophe Filter
- Remove Stop Words
- Remove Punctuation
- Stemming
- Lemmiation
- Spell Correction (Titles?)
- Grammar Correction (Titles?)
Text Wrangling – Part B Analyze Data
- Word Count/Frequencies
- Vocabularies
- Domain Dictionaries (Race, Sex, etc)
- Sentiment Analysis (positive, negative, confidence)
- Topic Modeling
- Self-Organizing Maps
- Trends/comparisons across time
- Trends/comparisons across subsets of data
- Trends/comparisons with external datasets
Analytics Team
- Sample representative sample articles across college source, time period, topics and other significant dimensions and read raw data articles to get an intuition as to the style, content and structure of the dataset.
- Think about what is distinctive or interesting about the dataset that you learned about in step 1.
- Think about what data/structure is missing from the dataset that could be augmented or contrasted or baselined with an external dataset.
- Formulate research questions that this particular dataset(s) alone or with external dataset mashups can answer in a strongest way. Generate at least 3-5 different and potentially interesting research questions that you think this dataset can particularly answer.
- Translate your research question into specific questions we can ask of the dataset. For example, searching for key terms, vocabularies, pos/neg sentiments, changes over time, comparison with contemporary newspaper sources, etc.
- Work with the technical Text Wrangler team to translate these questions into programs in a sequence of an increasingly specific line of questioning.
- During the iterative process, feel free to iterate, backtrack and modify your research question based upon prior results. Better to fail fast and approach the data with a new more productive/interesting research question than to pour a lot of time into what will eventually be a relatively uninteresting or weakly supported claim.
Visualization Team
- Briefly read over the top-level tasks for both the Data Wrangler team and Analytics Team to get a preview of what data you may be given to visualize and what are the important ideas to convey with the data/results.
- In particular, try to get an intuition for the both the underlying data as well as the analysis that will result in final datasets you’ll need to visualize.
- Read about current best practices in Data Visualizations
- Quickly review a number of contemporary Data Visualization galleries to get a concrete idea of how data/analysis results are expressed today.
- Drill down into our tool of choice to understand how to quickly generate some interesting visualizations with sample code, templates, etc.
- Communicate with the other teams, especially the Analytics Team to harmonize between the dataset resulting from the analysis and what the main ideas that need to be expressed/emphasized in as the research results.
Leave a comment